Guide 08 · All guides
Silver and Gold: Why People Hold Each
Industrial use, monetary history, bulk, and liquidity. Why people hold each. No allocation advice.
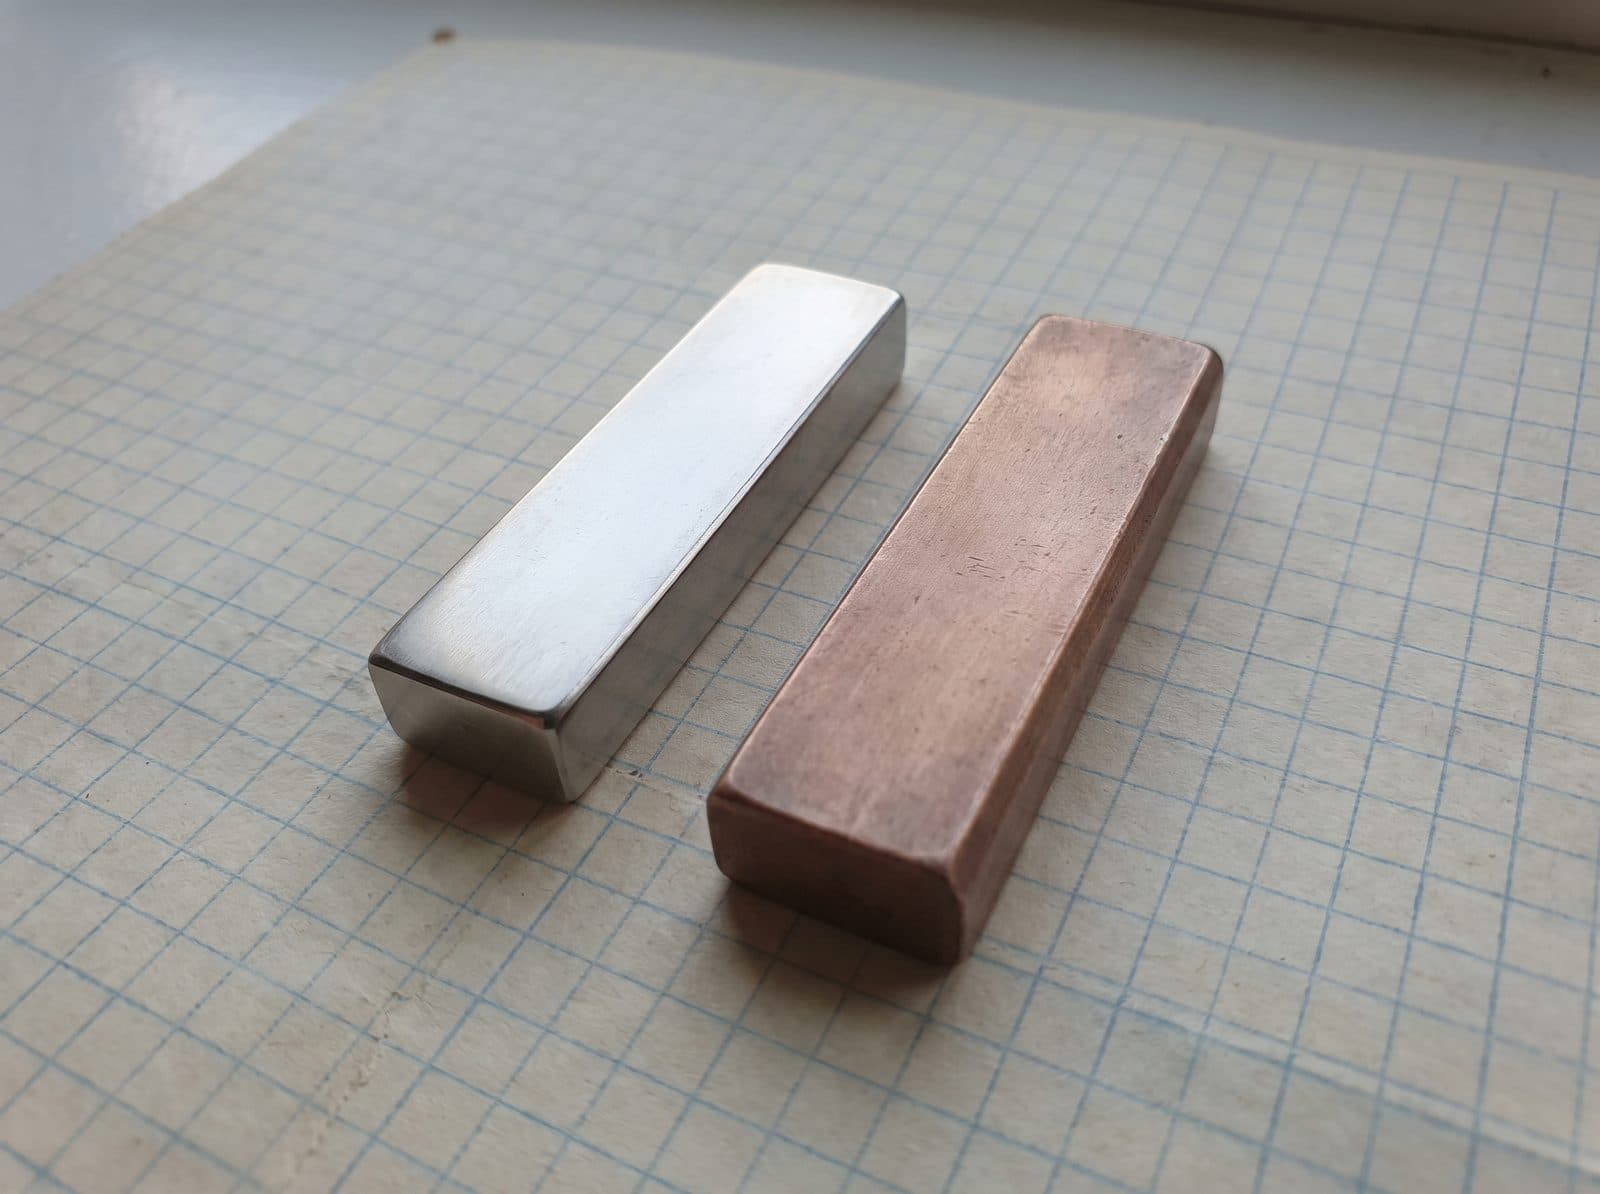
People hold gold and silver for different jobs. Gold is mostly a monetary and jewelry metal. Silver is both a monetary metal and an industrial metal. That split, plus the fact that gold costs much more per ounce, is why the same dollar amount of silver is bulkier and why the two markets do not move as one thing.
This is a description of uses and tradeoffs. It is not an allocation, and it is not a claim that one metal will do better than the other.
What each metal is used for
The U.S. Geological Survey’s Mineral Commodity Summaries 2026 (data for 2025) is a calm place to start.
On a narrow screen, scroll sideways for the full diagram.
For silver in the United States, estimated domestic uses:
| Use | Share |
|---|---|
| Electrical and electronics | 25% |
| Other industrial uses and photography | 19% |
| Net physical investment in bars | 18% |
| Photovoltaics | 15% |
| Coins and medals | 14% |
| Jewelry and silverware | 6% |
| Brazing and solder | 3% |
The same sheet notes silver’s high electrical conductivity, ductility, malleability, and reflectivity, and lists further uses in batteries, catalysts, mirrors, water treatment, and medical products. In November 2025, silver was added to the U.S. List of Critical Minerals.
Add those industrial lines and you get a metal that factories consume. Photography used to dominate silver demand. Digital imaging replaced most of that. Electrical contacts, electronics, and solar cells are now the large industrial sinks. Jewelry and tableware still matter, but they are not the main U.S. story.
For gold, the USGS reports estimated global consumption (excluding exchange-traded funds and similar products):
| Use | Share |
|---|---|
| Jewelry | 40% |
| Physical bars | 24% |
| Central banks and other institutions | 21% |
| Official coins, medals, and imitation coins | 7% |
| Electrical and electronics | 7% |
| Other | 1% |
Jewelry plus bars plus official institutions is most of the gold that is fabricated or stacked in a given year. Electronics are real — gold does not tarnish, and a little of it goes a long way on a connector — but they are a thin slice next to silver’s industrial share.
Those two tables are why people talk past each other. A silver user is often a fabricator. A gold user is often a jeweler, a central bank, or a person stacking bars. Both metals have investment demand. Only silver has a large, ongoing industrial bid that can rise or fall with electronics and solar production.
Monetary history, in short
Both metals were money for a long time. That is not a slogan. It is statute and mint practice.
The Coinage Act of 1792 set a U.S. dollar in silver and a gold-to-silver mint ratio of 15 to 1. Later acts changed the ratio and the alloys. For most of the nineteenth century the United States was, in law or in practice, on a bimetallic or gold standard. Circulating dimes, quarters, and halves were 90 percent silver until the Coinage Act of 1965 removed silver from those denominations. (The 10 percent in that alloy was copper. It is not a silver origin statute.)
Gold left everyday U.S. pockets earlier. The United States ended domestic gold convertibility in 1933. It closed the last official gold window for foreign governments in 1971. After that, gold’s official job in the U.S. monetary system was as a Treasury reserve asset, not as circulating coin. The USGS still reports a large Treasury gold stock, carried at the old statutory book value.
Silver’s official job shrank too, but the metal never stopped being used in industry. That is the modern split: gold kept a reserve and jewelry identity; silver kept a factory identity and a smaller coin-and-bar identity.
People who hold gold often describe it as a monetary reserve they do not have to explain to a central bank. People who hold silver often describe it as a cheaper ounce with a second, industrial source of demand. Those are motives. They are not forecasts.
Relative price and bulk
Gold’s price per troy ounce is much higher than silver’s. The USGS estimated 2025 annual average bullion prices at about $3,300 per ounce for gold and about $38 per ounce for silver. Those are yearly averages, not a live quote and not a target. The gap is the point: one ounce of gold is a large dollar amount in a small disc. The same dollars in silver are many more ounces.
On a narrow screen, scroll sideways for the full diagram.
Storage follows the arithmetic. Silver is dense — about 10.49 grams per cubic centimeter — but it is still bulky per dollar next to gold. A safe or a vault box fills up faster with silver. Shipping and insurance take a larger bite per dollar, which is one reason retail silver premiums, as a percent of melt, often run wider than gold premiums. The minting press charges per piece. The piece is worth less when it is silver. See Silver premiums explained and Storing physical silver.
The old U.S. mint ratio of 15 to 1 is history, not a fair-value model. Market ratios move. This article does not state a current ratio and does not say where one “should” be.
Divisibility is the other side of bulk. A 1 oz silver coin is a small dollar unit. A 1 oz gold coin is not. People who want small, recognizable pieces often end up with silver coins or 90 percent U.S. coin for that reason alone. People who want a lot of value in a small space often end up with gold. Again: a storage and unit-size observation, not a performance claim.
Liquidity
Both metals have deep wholesale markets. COMEX gold and silver futures, and the London bullion market, are the institutional references. Retail liquidity is narrower.
A widely recognized 1 oz gold coin is easy to sell in small lots almost anywhere bullion is bid. A widely recognized 1 oz silver coin is also easy to sell, but you are moving more pieces and more weight for the same dollars. Generic silver bars are bid closer to melt and may take a longer conversation. Large silver bars are efficient to store and clumsy to sell in grocery-sized slices.
Gold’s central-bank bid, in the USGS figures, has no real silver equivalent. That does not make gold “safer.” It means one large class of official buyer is mostly in gold. Silver’s industrial bid has no real gold equivalent. That does not make silver “higher growth.” It means fabrication can tighten or loosen the physical market even when investment demand is quiet.
Paper claims — futures, unallocated accounts, exchange-traded products — exist for both metals. They track a price. They are not a coin in a box. If the reason you hold the metal is to hold the metal, the product is the bar or coin, not the ticker.
Why people hold each, without a verdict
Hold gold if the job is compact value, a long monetary history, and a market that official institutions still buy as metal. Expect less industrial “use-up,” more jewelry and reserve behavior, and less bulk in the safe.
Hold silver if the job is a lower dollar unit, a metal factories still consume, and a willingness to store more weight. Expect industrial demand to matter, premiums per ounce to take a larger share, and resale to involve more pieces.
Hold both if those jobs are different. Many people do. That is a division of labor, not a formula.
Do not turn any of this into a percent. Do not treat last year’s industrial number as next year’s price. The USGS tables describe where metal went. They do not tell you what to own.
This article is educational only. It is not a recommendation to buy or sell silver or gold, and it is not tax or investment advice.
FAQ
Is this an allocation recommendation?
No. This is a description of uses and tradeoffs. It is not an allocation, and it is not a claim that one metal will do better than the other.
How do the uses differ (USGS framing)?
Gold is mostly a monetary and jewelry metal. Silver is both a monetary metal and an industrial metal. Only silver has a large, ongoing industrial bid that can rise or fall with electronics and solar production.
Why is the same dollar amount of silver bulkier?
Gold’s price per troy ounce is much higher than silver’s. The USGS estimated 2025 annual average bullion prices (~$3,300 gold, ~$38 silver) illustrate the gap; they are not a live quote and not a target.
Is the old 15-to-1 mint ratio a fair-value model?
No. The old U.S. mint ratio of 15 to 1 is history, not a fair-value model. This article does not state a current ratio and does not say where one “should” be.
Do the USGS tables tell me what to own?
No. They describe where metal went. They do not tell you what to own.